Properties of quadratic graphs
Quadratic equations can easily be identified as an x term is always squared. The general format for a quadratic equation is:

You can also identify a quadratic graph quite easily when looking at it. It has a distinct U-shape or ∩-shape when negative.
A quadratic equation generally has two x-intercepts and to find these you can use the quadratic formula:

Inputting the values into this equation first for the positive and then for the negative gives two values which can be plotted on the graph.
Real roots

You may notice that the discriminant which is the value under the square root sign may give a negative number, in this case the equation has no real roots and does not cross x-axis. The value would end up being an imaginary number.
If the discriminant is 0 then it touches the x-axis and has just the point which is the minimum or maximum of the curve (gradient = 0) at this point.
So, to summarise mathematically:


Finding the minimum/maximum
The point where the curve has a gradient of 0 and switches direction is the maximum or minimum depending on the shape of the graph. This point can be calculated using the axis of symmetry determined by the following formula:

So, if we use this to determine the x value, the y value would simply be this value substituted into the original equation.
Technically this is all the information we need to graph the curve now. You can get more points of the curve by choosing a value for x, substituting into the equation and then seeing what value is given for y.
How to sketch a quadratic graph
Taking into account the above, here are the steps to sketching a quadratic and getting all the information you need
- Determine the shape of the graph based on the x squared term’s sign.
- Find the minimum/maximum of the curve using the formula for x and substituting for y
- Find the X-intercept and Y-intercept. The X-intercept may have two values and you use the quadratic formula to determine these two values. If the discriminant is negative then it has no real roots and does not cross the x-axis
- Determine some points close the minimum/maximum point to help plot the graph
Let’s consider the following quadratic equation:

If you see the term f(x) it means the function of x and is basically equal to the y value.
Step 1) Determine the shape
The shape of this graph is based on the coefficient of the x2 term, also known as A. The coefficient is 1 is no other value representing A. This is positive and so that mean the shape will be U shaped.
Step 2) Find the minimum
We are finding the minimum here because the A term is positive if it was negative, we find the maximum.
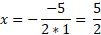
The minimum for x part of the coordinate is as follows:
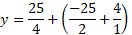
The minimum for y part of the coordinate is as follows:


So, the coordinate for the minimum value of this quadratic is:

Step 3) Find the X-intercepts of the equation
If you just require graphing the equation so far you can actually skip to the next step for plotting additional points, however if you are asked a question involving finding real roots then this is required.
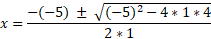
We can simply substitute the values we have into the quadratic formula:
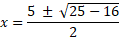


We have simplified enough here to determine a value for both the plus and minus sign:


Now for the minus:


So, x = 1 and 4, when y = 0
So right now, we have 3 points we can put on a graph which are the following:
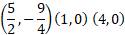
On a graph it looks like this:
Step 4) find some more points
The last step is quite simple. All you have to do is choose at least 2 values where is x is close to the minimum x we found earlier and you could use the x-intercepts we found for reference as well. They don’t have to be fractions like the x value; we can pick any integer.
So, in our example, 5/2 is the x value, this is just 2.5. The intercepts we found have x values of 1 and 4, so we could start with x = 0 and x = 5 and determine the relevant y values by substituting into the original equation so let’s do that:


Now for x=5:


You will notice that the y value is the same for both of these values. This isn’t a coincidence, the graph is a parabola and has a line of symmetry going through the gradient 0 point, so any value we pick at equal distance apart from the minimum is going to have equal y value.
So now we have two more points to plot:

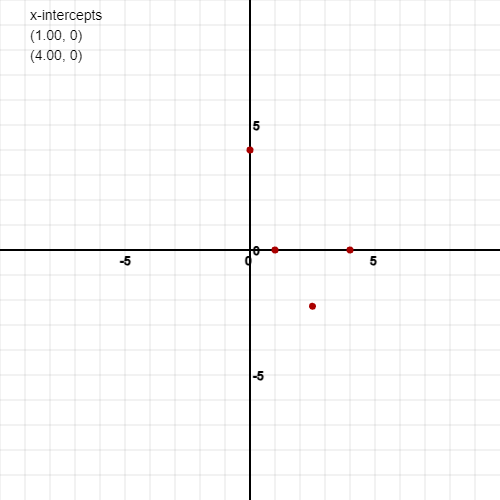
In total we can plot the following points:
This is more than enough to draw the graph but you can keep choosing more x values if you want a more accurate graph but it will probably go off the page as the graph gets big quite quickly.
So here are the points on the graph:
Now all that is left to do is sketch the curve through these points:
And that’s it! It may seem like a lot of steps but if you remember the 4 steps from before in short form and practice sketching graphs with these rules it will be easy to remember. A lot of this requires visually understanding a graph and why it creates a curve too.