Properties of logarithmic graphs
Logarithmic and exponential graphs are related because a logarithmic graph can be used to show the inverse relationship between a variable and its logarithm.
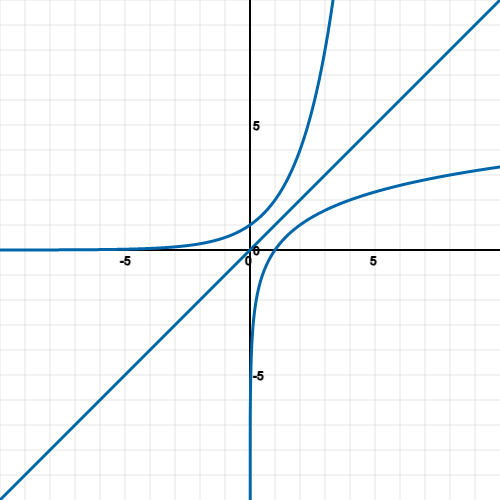
The two graphs are related in that the logarithmic graph is the inverse of the exponential graph. This means that when one graph increases, the other decreases.
Graphs of logs and exponentials are symmetrical along the line of y = x as they are inverse functions of each other.
Graphs of loga(x) have a vertical asymptote approaching y = 0 and so never touches or cross the y axis.
Graphs of ax have a horizontal asymptote approaching x = 0 and so never touches or crosses the x axis.
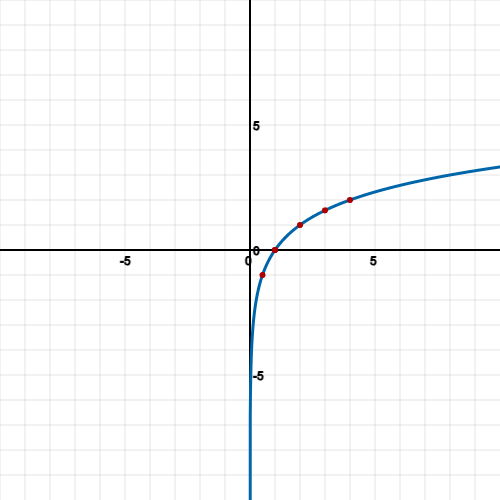
In order to graph log functions, you can simply take a value of y and input into the equation given and create points to form a sketch.
For example, sketching log2(x) would have the following points:
 | 0.5 | 1 | 2 | 3 | 4 |
 |  |  |  |  |  |
If you input values of x ≤ 0 then you will get undefined as no number raised to the power of a base number can equal 0 or less than zero.
You can find the Y-intercept by setting x = 0:


There is no Y-intercept for this equation, but other equations may have it.
You can find the X-intercept by setting y = 0:


Now we have enough points to sketch a graph:
Example
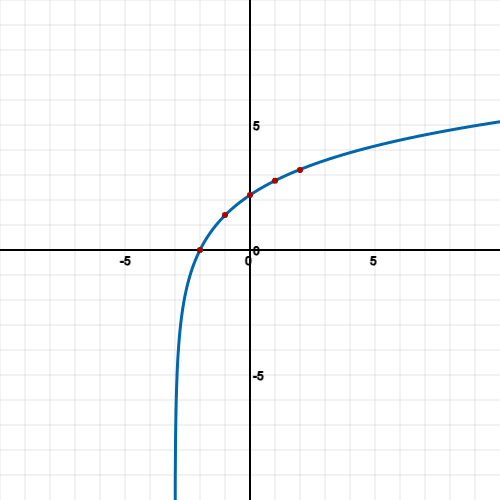
Sketch the graph of the following equation:

Answer:
First plot various points of x:
| -1 | 1 | 2 |
| 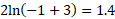 |  |  |
Next find the y-intercept:

Next find the x-intercept:

Using ln = log base e:


Now sketch the graph with intercepts and plotted points: