Venn diagrams and probability notation
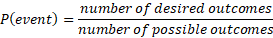
Probability is a measure of how likely random events can occur. There is the total possible outcomes and the desired events that can occur by chance. We can measure the chance of something using the formula above.
Example
What is the probability of picking an ace in a set of 52 playing cards?
As there are 4 aces, there are 4 chances of this desired event occurring and so you divide this over all possible outcomes which is 52 cards.
Venn diagrams are a useful visual element to understanding how outcomes can occur for multiple events. Venn diagrams would need at least 2 events, which can be labelled event A and event B.
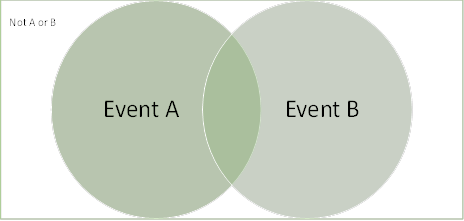
The individual event probabilities can simply use the notation P(A) or P(B) if you just need the outcomes of one event.
Events can also be described as not happening which can be the same event but with an apostrophe representing this as the compliment e.g., P(A’) would be the probability of A not happening.
To describe the middle part of the Venn diagram, which describes the outcomes as satisfying both events, is shown as P(A ∩ B). This is called the intersection.
To describe any of the outcomes satisfying either of the events in the diagram, it is shown with P(A ∪ B). This is called the union.
Example
Using the below Venn diagram, find the following probabilities:
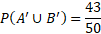
P(A), P(B) P(A’), P(B’), P(A ∪ B), P(A ∩ B), P(A ’∪ B) P(A ’∪ B’)
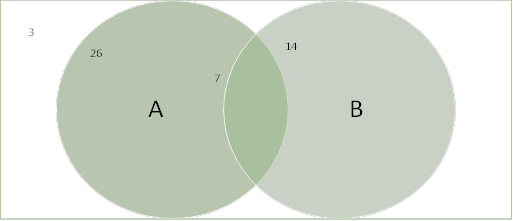
Before calculating, we can first determine that the number of all possible outcomes is the total of all numbers which is equal to 50.
We can now calculate the above probabilities:

The probability of one event is the inclusion of the values in the intersection and so that is why the above event is 33 and not 26.


Tree Diagrams
Tree diagrams are good way to calculate probability of chained events. The branches represent possible outcomes and the end of the branches represents the events. You can find the probability of a series of outcomes by multiplying the branches going across.
The probability of the branches should add up to 1 in one set of branches.
Example
If we flip a coin once we have a 0.5 chance of flipping heads or tails, if we flip it again, we will have the same possible outcomes but the probability of flipping the same face is halved. We can represent this in a probability tree:
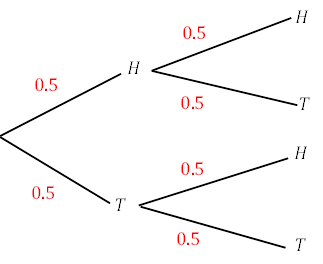
The probability of flipping heads twice in a row is the branches multiplied together. So, in this case:

Tree diagrams are useful to visualise the probability of events that happen consecutively.
Conditional probability
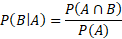
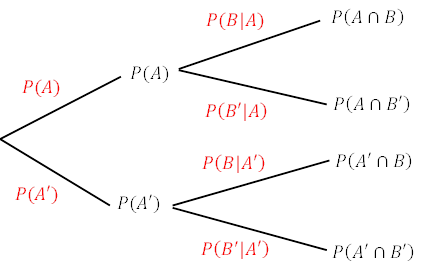
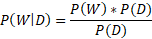
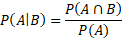
Conditional probability is the probability of an event given than another event has already happened. So, the events are linked. In the equation above, P(B|A) is the probability of B given that A has already happened.
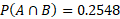
The intersection of the two events in the formula P(A∩B) is the branches probability multiplied. The probability of just P(A) is the branches of all those events occurring multiplied and added together.
Example
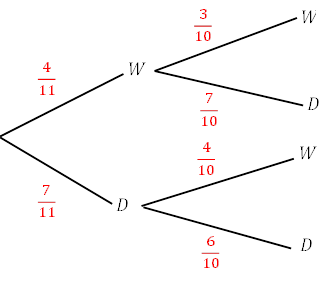
- A box contains 4 white chocolates and 7 dark chocolates. Two chocolates are taken out one at a time randomly and eaten straight away.
- Draw a probability tree to represent the all the possible outcomes of eating specific types of chocolate.
- Find the probability that at least one of the chocolates are white.
- Find the probability that the second chocolate is white given that the first chocolate is dark.
a) The probability tree can be represented with two starting branches followed by 2 more branches for each:
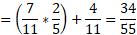
b) The second question relates to finding all possibilities of at least one of the chocolates are white. One option will have the probability that the first chocolate is white meaning the second chocolate probability is irrelevant.
The first chocolate being dark means we just need to multiply this probability P(D) by the probability the second is white P(DW) and then add this to the probability that the first is white.

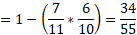
This can also be rewritten as the probability of not choosing P(DD):

c) This question can use the conditional probability formula as the question asks for a probability given that something has already happened
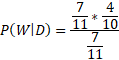

In this case, the probability that the second chocolate is white given the first is dark is simply the probability of that branch itself.
Mutually exclusive events

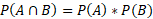
Events that are mutually exclusive mean they cannot occur together and so have no intersection.
Example
The probability of rolling a 4 on a dice and rolling a 6 on a dice both have the same probability of 1/6. They have no intersection as rolling both events are impossible and so they are mutually exclusive.
Independent events
Independent events are events that do not depend on one another to affect their probability.
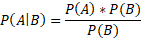
Given that the conditional probability formula provides an equation which uses the intersection of the events, we can substitute the equation above and find a simpler equation for conditional probability of independent events:

Example
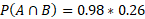
The probability that I go to work tomorrow (A) is 98%. The probability that it rains tomorrow is 26%. These events can happen at the same time but they are not dependent on each other and so they are independent events.
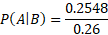
You can calculate this using the conditional probability formula.
If:
Then they are independent.

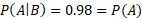
As shown, these events are independent.
Discrete random variables
Discrete random variables (X) are the values in which there are probabilities that these values can have. A discrete probability distribution can be represented as a tabular set of values showing all the possible values of X and their probabilities. All the probabilities add up to one.
Example
- The discrete random variable X takes the values 0, 1, 2 and 3 has the probability distribution in tabular form below.
- Find the value of k
 | 0 | 1 | 2 | 3 |
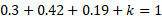
 | 0.3 | 0.42 | 0.19 | k |
a) To find this value we can use the equation above that says the sum of all probabilities add up to 1. So,


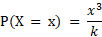
The probability of X = x can be equal to a function in itself where introduction of other variables, usually denoted k, can be used to formulate probability values based on the X value and the k value.
For example:

This means that the value of the probability of X would be some unknown value k multiplied by each value: x. Generally, this unknown value is found via the same formula from earlier as all the probabilities must add up to one.
Example
Find the value of k and the probability of P(X < 2) and P(2 ≥ 3) for the probability function of the discrete random variable X. Where x = 0, 1, 2, 3
The value of k can be found using the same methods from the previous example, except this time a table is not given so it can be constructed to make the problem easier to understand:
| 0 | 1 | 2 | 3 |
|  |  |  |  |
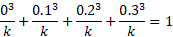
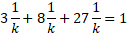
Using the sum formula, we can rearrange the values to solve for k:


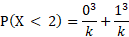
For the inequality probabilities, this is simply the probabilities summed together in that specified range. So for P(X < 2):

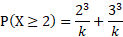
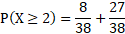
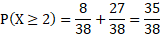
And for P(2 ≥ 3):